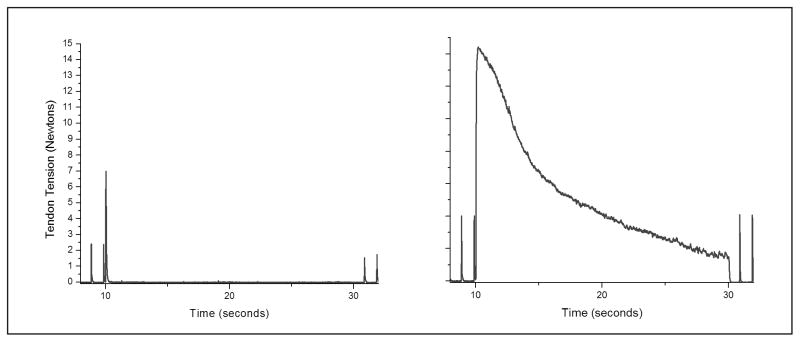
Figure 2.
Comparison of onset response characteristics in the same nerve (rat sciatic) using different frequency and amplitude. The scales are the same in each plot, and block is delivered from 10 seconds to 30 seconds. The plot on the right is with KHFAC of 10 kHz and 10 Vpp and shows onset activity for the whole period. The plot on the left is with a KHFAC of 30 kHz and 10 Vpp and has a very brief onset response of lower amplitude.

