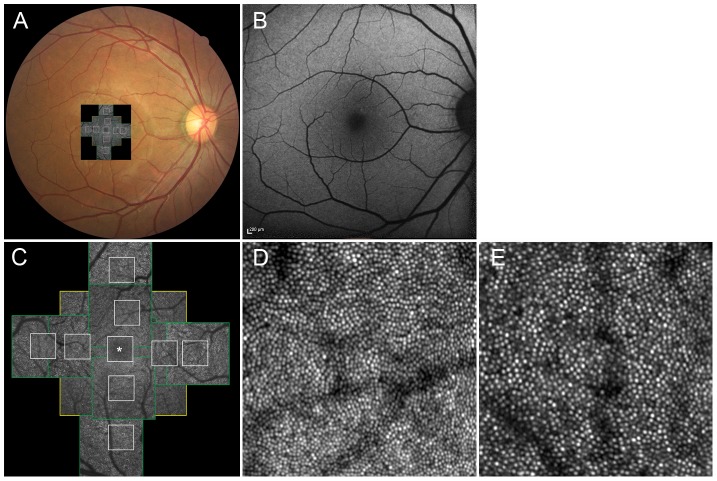
Figure 1. Normal cone photoreceptors.
(A) Adaptive optics scanning laser ophthalmoscopy (AO-SLO) image registered on color fundus photograph. (B) Fundus autofluorescence (FAF) imaging. (C) Montage of a series of high-resolution images from the central fovea outward to 1.5 mm from the center of the fovea, obtained by AO-SLO. Asterisk = foveal center. First, 3 different field of view images (L [yellow box]: 1700×1700 µm, M [green box]: 820×820 µm, S [white box]: 340×340 µm) centered on the center of the fovea were obtained, followed by 2 field of view images (M and S) centered 0.5 mm and 1.0 mm from the center of the fovea at each direction (superior, nasal, inferior, temporal) (D and E) Representative images of areas 0.5 mm (D) and 1.0 mm (E) from the center of the fovea (340 µm×340 µm area).

