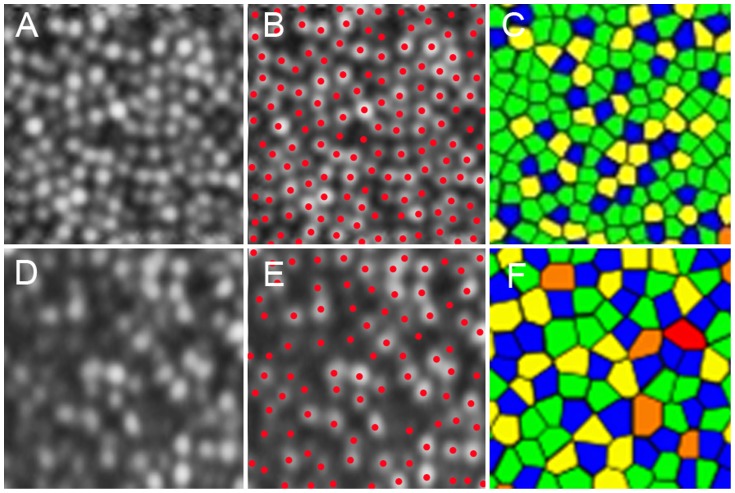
Figure 2. Cone labeling and cone density/arrangement measurement.
(A) A cone mosaic image 0.5 mm from the center of the fovea in a normal eye. (B) Cone labeling results. (C) Voronoi diagram. The colors indicate the number of sides of each Voronoi polygon (pink, 4; blue, 5; green, 6; yellow, 7; and orange, 8). (D) A cone mosaic image 0.5 mm from the center of the fovea in an eye with retinitis pigmentosa (RP). (E) Cone labeling results. (F) Voronoi diagram. The colors indicate the number of sides of each Voronoi polygon (pink, 4; blue, 5; green, 6; yellow, 7; and orange, 8). The cone densities are 27,275 and 13,102 cones/mm2 in the normal eye and the eye with RP, respectively. Proportions of 6-sided Voronoi polygons were 54.1% and 40.0% in the normal eye and the eye with RP, respectively. The ratio of observed average nearest-neighbor distance (NND) for each subject divided by expected NND was 0.795 and 0.723 in the normal eye and the eye with RP, respectively.

