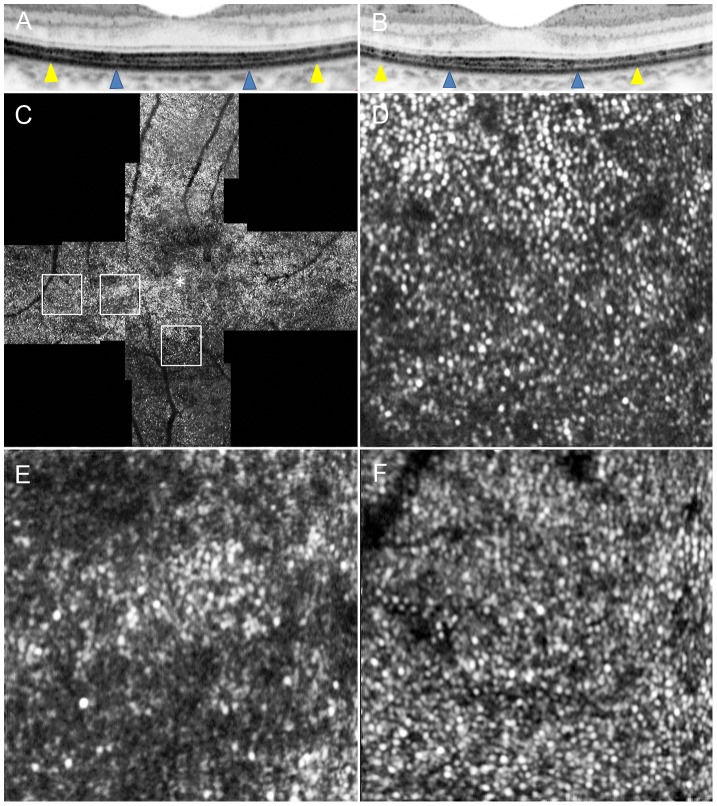
Figure 7. Adaptive Optics Scanning Laser Ophthalmoscopy Image of Case 14.
Images of Case 14. (A) OCT image in a high magnification view of horizontal scan corresponding to the area scanned by AO-SLO. (B) OCT image in a high magnification view of vertical scan corresponding to the area scanned by AO-SLO. Blue arrowheads indicate 0.5 mm from the center of the fovea, and yellow arrowheads indicate 1.0 mm area from the center of the fovea. (C) AO-SLO images of Case 14. The images show cones with patchy dark areas representing cone loss. Dark areas are seen even in the area where the IS ellipsoid is continuous on SD-OCT (Fig. 6). (D) A high-magnification image at 0.5 mm in the inferior direction from the center of the fovea. (E) A high-magnification image at 0.5 mm in the temporal direction from the center of the fovea. (D) A high-magnification image at 1.0 mm in the temporal direction from the center of the fovea. The asterisk indicates the foveal center.

