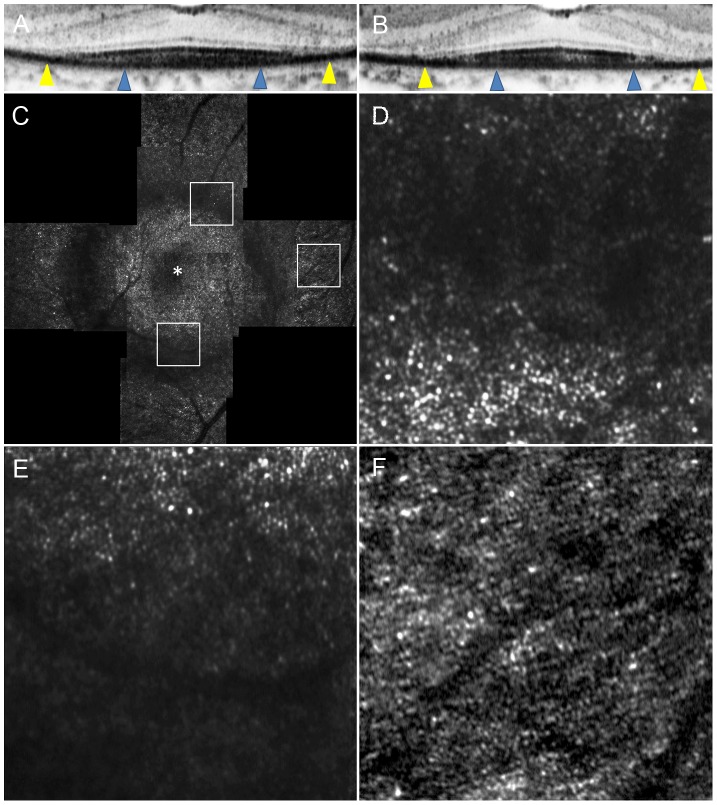
Figure 9. Adaptive Optics Scanning Laser Ophthalmoscopy Image of Case 12.
Images of Case 12. (A) OCT image in a high magnification view of horizontal scan corresponding to the area scanned by AO-SLO. (B) OCT image in a high magnification view of vertical scan corresponding to the area scanned by AO-SLO. Blue arrowheads indicate 0.5 mm from the center of the fovea, and yellow arrowheads indicate 1.0 mm area from the center of the fovea. (C) AO-SLO montage images of Case 12. The images show a large dark annular lesion (arrows) where cones are missing, which corresponds to the area where IS ellipsoid is disrupted on SD-OCT (Fig. 8). (D) A high-magnification image at 0.5 mm in the superior direction from the center of the fovea. (E) A high-magnification image at 0.5 mm in the inferior direction from the center of the fovea. (F) A high-magnification image at 1.0 mm in the temporal direction from the center of the fovea. The asterisk indicates the foveal center.

