
Fig. 2.
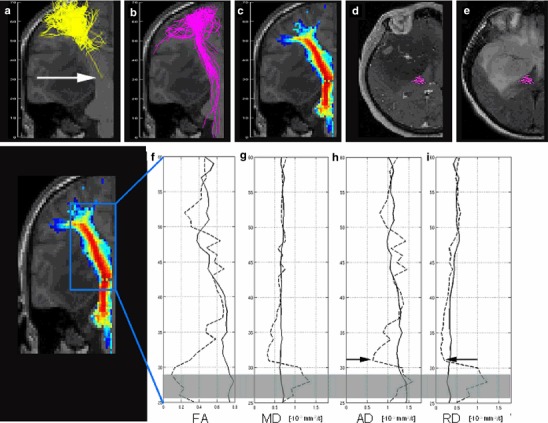
Patient #6 with a right fronto-temporal glioma with marked motor impairment. FACT algorithm (a) failed in the depiction of the CST, whereas GT (b) and probabilistic maps of connectivity (c) performed well. Fibres of FACT and GT are given as projections, probabilistic maps of connectivity as cross section. The diagrams display the values of FA fractional anisotropy (f), MD mean (g), AD axial (h) and RD radial diffusivity (i) (given in n × 10−3 mm2/s), obtained from the CST on the pathologic (dotted line) and the contralateral side (solid line) from the top (z = 60 mm) to the bottom (z = 25 mm). All diffusivities were restricted at the level of z = 32 mm (arrows in a, h and i). Transversal contrast enhanced T1-weighted (d) and T2- weighted images (e) at this level showed a mass effect, dislocation and compression of the CST. The grey bar in f through i indicates an area of distortions in the diffusion weighted images in this case