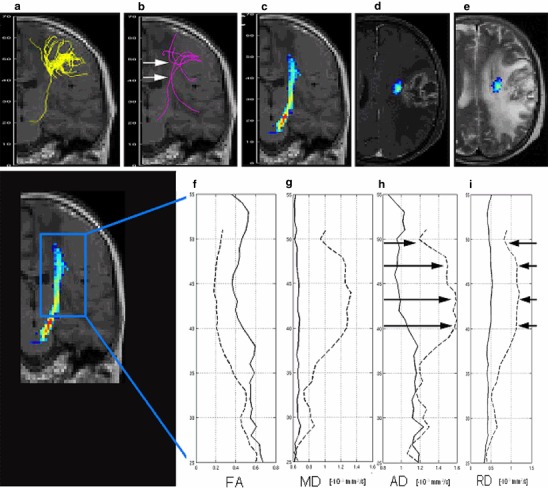
Fig. 3.

Patient #7 with a left frontal glioma with marked motor impairment. FACT algorithm (a) and GT (b) failed in the depiction of the CST, whereas probabilistic maps of connectivity (c) could depict it. Fibres of FACT and GT are given as projections, probabilistic maps of connectivity as cross section. Plots display the values of FA fractional anisotropy (f), MD mean (g), AD axial (h) and RD radial diffusivity (i) (given in n × 10−3 mm2/s), obtained from the CST on the pathologic (dotted line) and contralateral side (solid line) from the top (z = 55 mm) to the bottom (z = 25 mm). All diffusivities were increased at the level between z = 40–48 mm (arrows in b, h and i). Transversal contrast enhanced T1-weighted (d) and T2-weighted images (e) at this level showed a contrast-enhancing tumour in the direct vicinity of the CST and a high signal on T2-weighted images. Both, the tumour infiltration and the vasogenic oedema cannot be distinguished from each other
