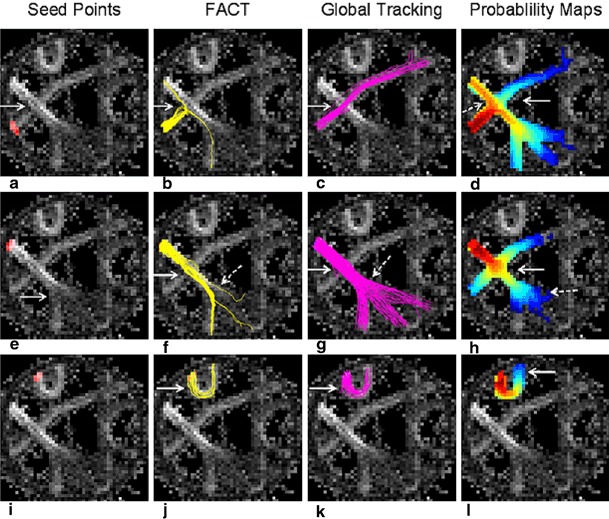
Fig. 5.

Comparison of the tractography algorithms on the physical phantom. The phantom (3) is displayed as FA map. It contains a fibre crossing on the left side (white arrow in a). The tract crossing from the left upper corner to the right lower direction (seed point indicated in red on e) has a higher FA than its counterpart from the left lower area to the right upper direction (seed point on a). In the upper part of the phantom a strong fibre bending is present (seed point on i). In the lower part, a fibre splitting is contained (white arrow in e). FACT was not able to overcome the crossing over the tract with the higher FA (arrow in b). Instead, false fibres were found. Along the tract with the higher FA, FACT successfully overcame the crossing (solid arrow in f). It only found minor and unequal parts after fibre splitting (dotted arrow in f). The sharp bending tract was well found (arrow in j). GT overcame the fibre crossing from both sides (solid arrow in c and g), was able to detect fibres after splitting in nearly equal portions (dotted arrow in g) and went successfully along the fibre bending (arrow in c). PT was only partially successful in passing the crossing (solid arrows in d and h), but found false positive fibres during the crossing of the tract with higher FA (dotted arrow in d) and during the crossing along the tract with higher FA (solid arrow in h). The fibre splitting was not sufficiently depicted (dotted arrow in h). PT went successfully along the fibre bending (solid arrow in l)
