
Figure 3.
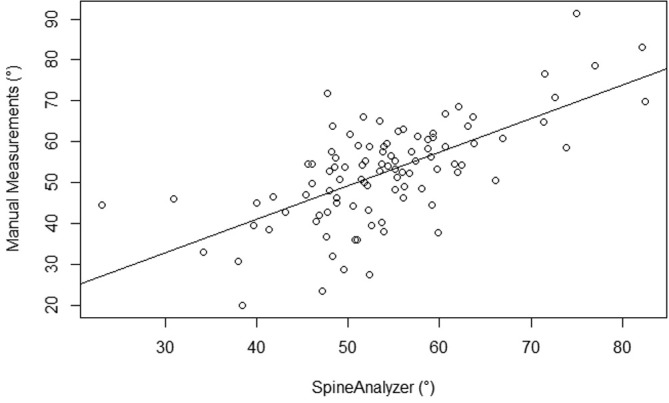
Correlation between the manual measurements (X-axis) and the calculations derived from the SpineAnalyzer® software (Y-axis) of the Cobb’s kyphosis angle in degrees between Th5 and Th12; Pearson’s correlation coefficient r=0.65 [95% confidence interval (CI): 0.53-0.75; P=2×10–13].