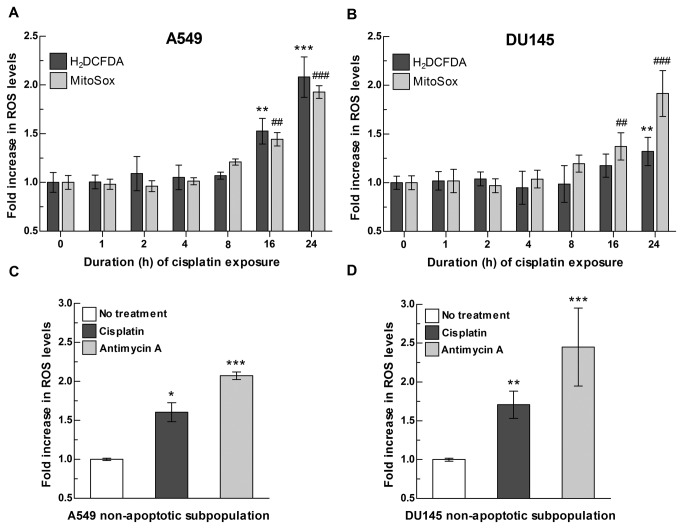
Figure 1. Cisplatin exposure induces an increase in total intracellular and mitochondrial ROS in non-apoptotic cancer cells.
(A-B) Temporal analysis of ROS levels following cisplatin exposure in (A) A549 and (B) DU145 cells. A549 and DU145 cells were exposed to cisplatin at an IC50 dose (12 μM and 20 μM, respectively) and ROS levels were measured at the indicated time points by incubating with H2DCFDA or MitoSox fluorescent probes. ROS levels in treated vs. non treated cells at each time point were analyzed independently for each probe by two-way ANOVA. For total intracellular ROS levels (H2DCFDA): treatment x time point interaction p<0.05 for DU145 cells and p<0.001 for A549 cells; Bonferroni post-test for multiple comparison: ** p<0.01, *** p<0.001. For mitochondrial ROS (MitoSox): treatment x time interaction p<0.001 for DU145 and A549 cells; Bonferroni post-test for multiple comparison: ## p<0.01, ### p<0.001. (C-D) ROS levels following cisplatin exposure in non-apoptotic (C) A549 and (D) DU145 cells. A549 and DU145 cells were exposed to cisplatin at an IC50 dose and ROS levels measured in Annexin V-negative subpopulation as described in Materials and Methods and in Figure S2. Antimycin A was used as positive control for mitochondrial ROS generation. ROS levels in treated vs. non treated cells were analyzed by one-way ANOVA (p<0.001 A549 and DU145 cells; Bonferroni post-test for multiple comparison: *p<0.05, **p<0.01, *** p<0.0001). Data are presented as fold increase over no treatment. Bars represent the mean of n=3-6 independent biological replicates +/- SD.

