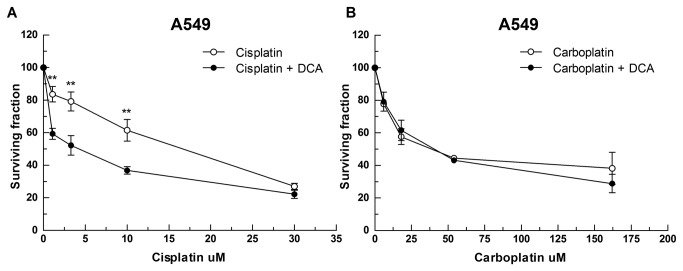
Figure 6. Metabolic state of the cell determines the contribution of the mitochondrial-ROS component to the cytotoxic effect of cisplatin.
Survival of A549 cells after 72 h exposure to a dose range of either (E) cisplatin or (F) carboplatin with or without exposure to 1 mM of DCA. Data represent mean of n=3 independent experiments +/- SD; **p<0.005.

