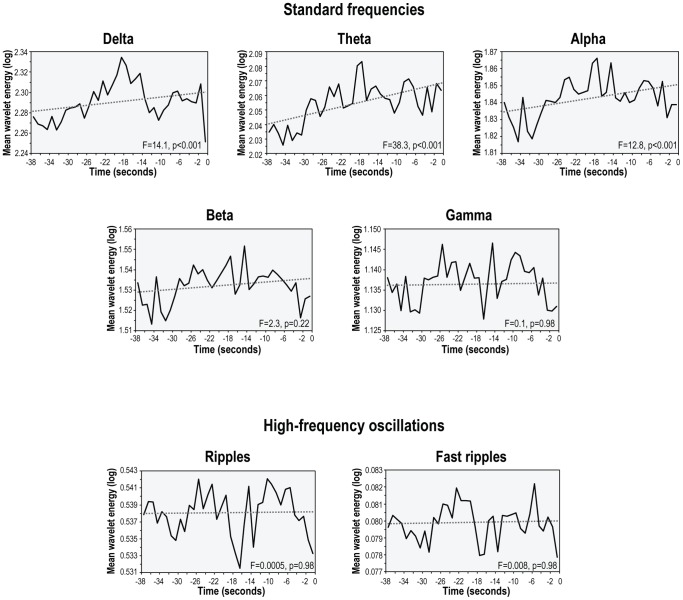
Figure 4. Time course of changes in the activity of different frequency bands over the entire preictal period extending from the beginning of the baseline to the end of the immediate preictal section in the entire patient sample.
The dashed line in each graph indicates the linear regression line. Note the significant linear increase over time in wavelet energy for three of the seven frequency bands (delta, theta and alpha).

