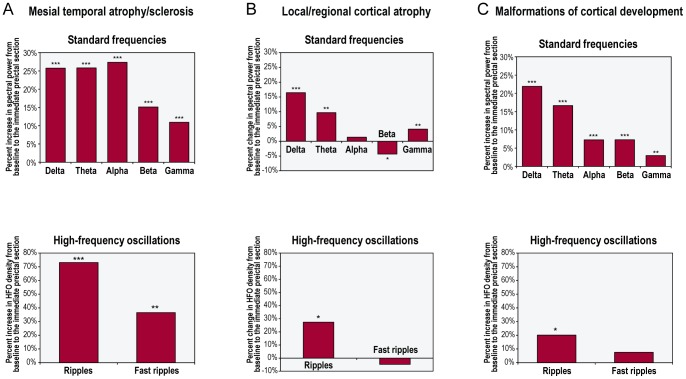
Figure 6. Preictal changes in the activity of different frequency bands in the three separate patient subgroups.
The groups were defined according to the underlying pathology: (A) mesial temporal atrophy/sclerosis (n = 15); (B) local/regional cortical atrophy (n = 10); and (C) malformations of cortical development (n = 18). ***p<0.001; **p<0.01; *p<0.05.

