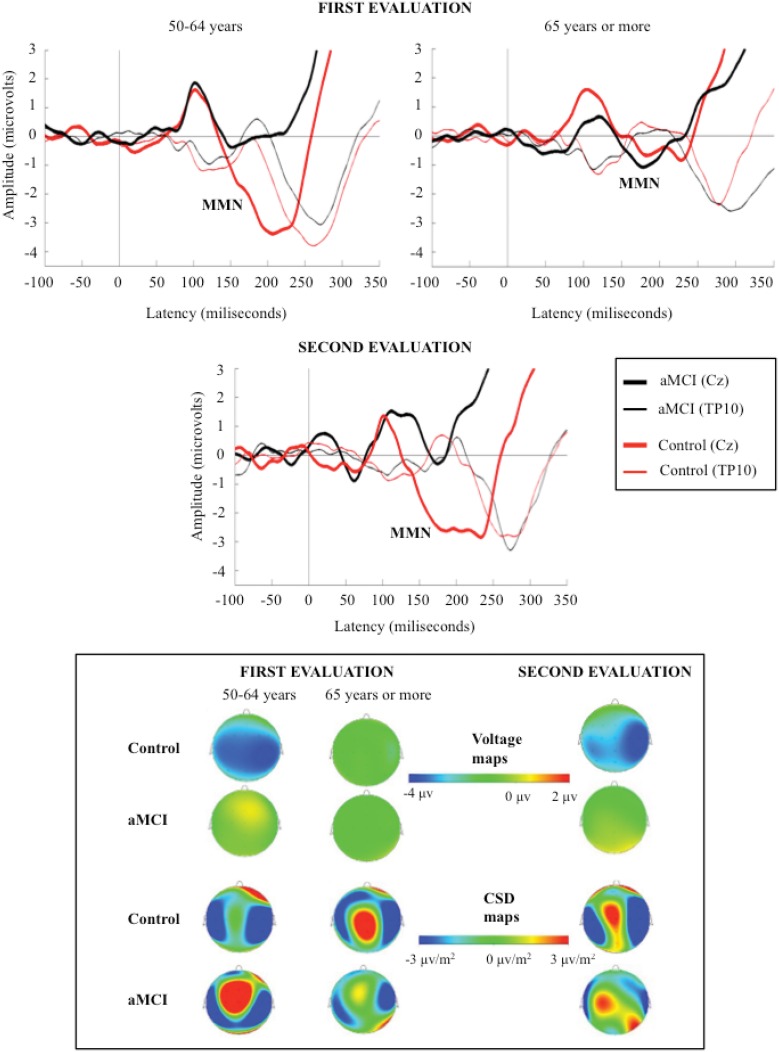
Figure 1.
Grand-average event-related potentials waveforms, measured at Cz (top), during the 350 ms after the stimulus, and voltage and current source density (CSD) maps for MMN maximum peak (bottom), in the novel minus standard difference waveforms, for control and aMCI adults, in the first (for the two age subgroups) and second evaluations.

