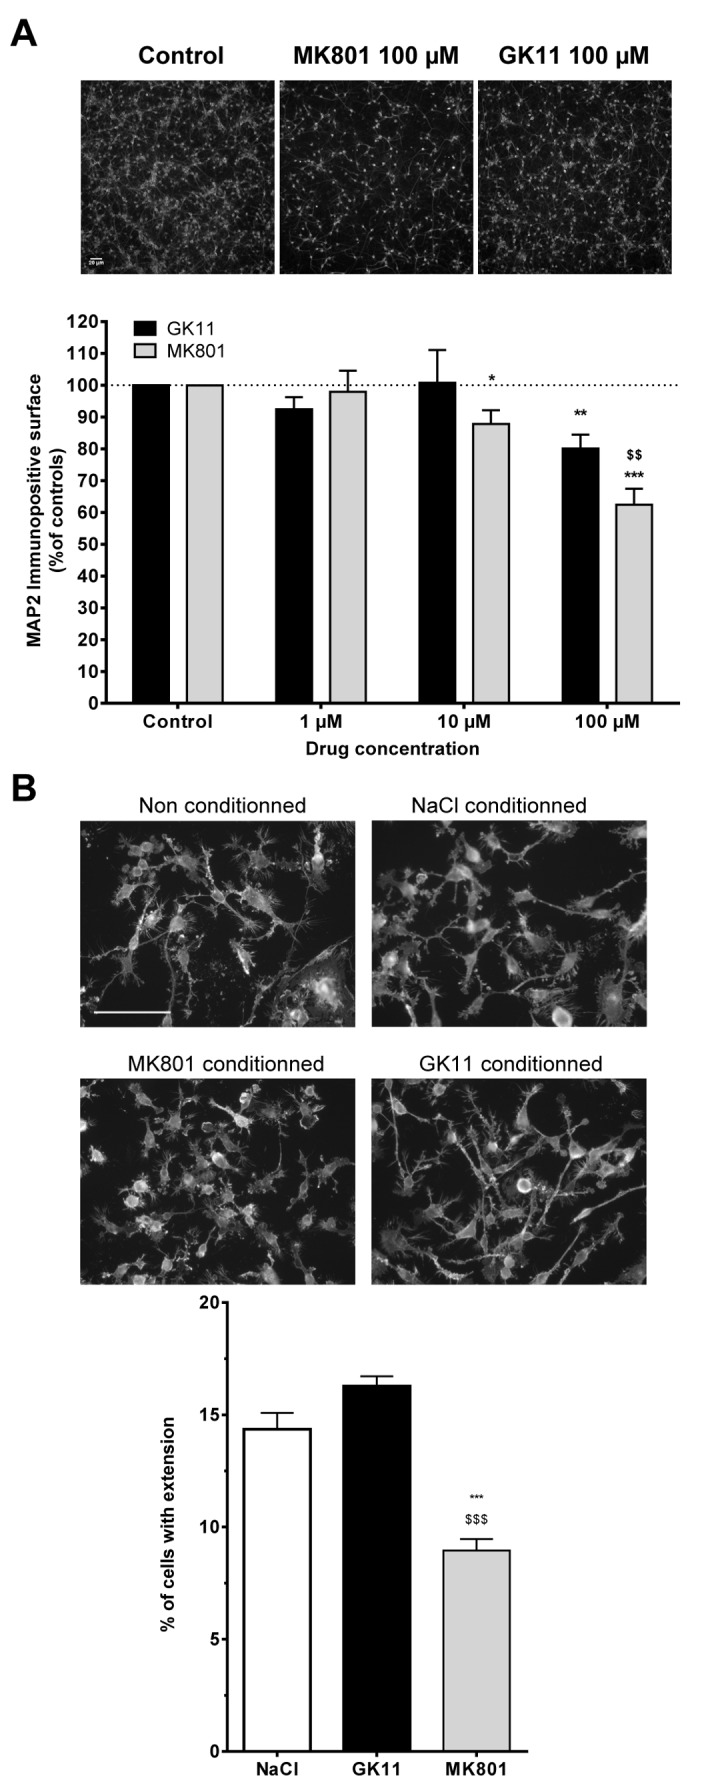
Figure 5. MK801-elicited microglial activation is caused by neuronal injury.

(A) Comparison of the intrinsic neurotoxicity of GK11 or MK801 on densely seeded and mature cortical cultures. Neuronal cultures were challenged for 48h with increasing concentrations of the NMDAR antagonists. Neuronal suffering was assessed by determining the MAP2-immunopositive surface. Photographs represent typical examples of MAP2-stained neuronal cultures (Scale bar = 20 µm). Bar graph represents quantitative analysis (mean ± SEM from at least three independent experiments). Y axis: % of MAP2-positive surface in neuronal cultures treated with MK801 or GK11 normalized to the sham-treated neuronal cultures. Statistical analyses were performed using two-way ANOVA followed by Fisher’s LSD post-tests. *: p<0.05; **: p<0.01; ***: p<0.001 when compared to controls. $: p<0.05; $ $: p<0.01: $ $ $: p<0.001 when compared to GK11 treated cultures.
(B) Effects of conditioned media obtained from Sham, MK801 and GK11-treated neuronal cultures on microglial BV-2 cells morphology. Cells treated with non-conditioned medium show a branched morphology with long processes, and only a few amoeboid cells can be seen. Cells treated with conditioned media from control (0.9% NaCl) or 100 µM GK11-treated neuronal cultures displayed similar morphology. In contrast, BV-2 cells treated with conditioned media from 100 µM MK801-treated neuronal culture show only a few short processes, and the majority of the cells had an amoeboid (“activated”) shape (Scale bar = 100 µm). The number of cells with at least one process (see Materials and Methods for further details) was quantified; the results are presented in the bar graph. The results are the mean ± SEM of quantitations performed in 3 experiments. Statistical analyses were performed using one-way ANOVA followed by Fisher’s LSD post-tests. ***:p<0.001 compared to controls; $ $ $:p<0.001 compared to GK11-treated cultures.
