Figure 3.

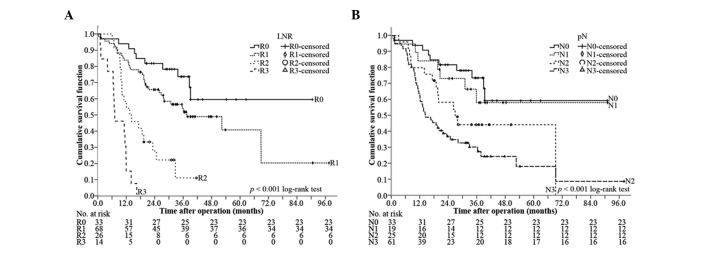
Kaplan-Meier survival curves, classified by (A) lymph node ratio (LNR) and (B) lymph node status (pN). The LNR could better divide the patients into four different groups than pN.

Kaplan-Meier survival curves, classified by (A) lymph node ratio (LNR) and (B) lymph node status (pN). The LNR could better divide the patients into four different groups than pN.