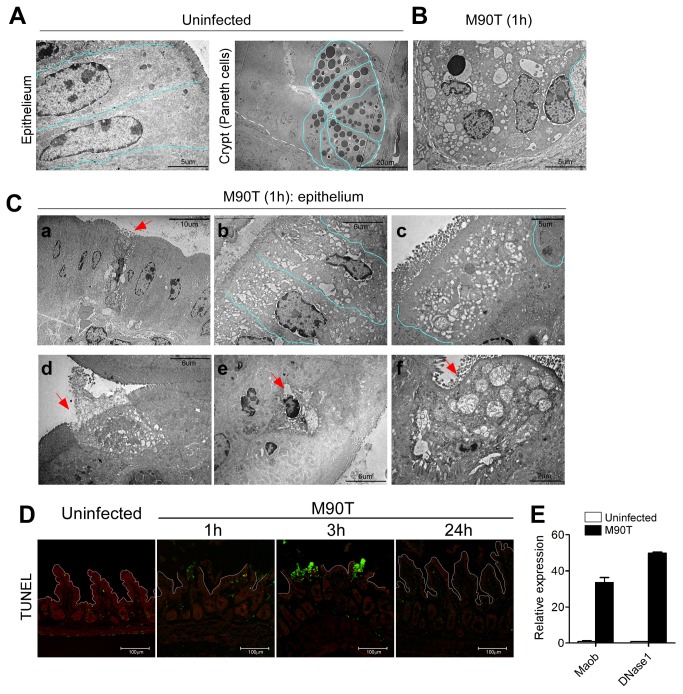
Figure 3. Intracellular alteration in Paneth cells of crypt and villous epithelial cells following oral M90T infection.
Transmission electron microscopy (TEM) images of cellular level alterations in terminal ileum 1 h after oral M90T infection (n=10). (A) Uninfected villous epithelial cells and Paneth cells in the crypt show normal intracellular organelles. (B) In crypt Paneth cells, some cells have condensed nuclei and ruptured plasma membranes making floods of intracellular organelles. (C) TEM images of intestinal epithelial cells; a) single dying cells (arrow), b) adjacent multiple cells have swollen mitochondria and disorganized cytoskeletal elements, c) abundant vacuoles in cytoplasm. Pale blue lines denote individual cells, d-f) TEM images of cell death in villous epithelial cells. (D) TUNEL staining in terminal ileum following oral M90T infection (n=5). (C) mRNA expression of MaoB and DNase I from terminal ileum following oral M90T infection.

