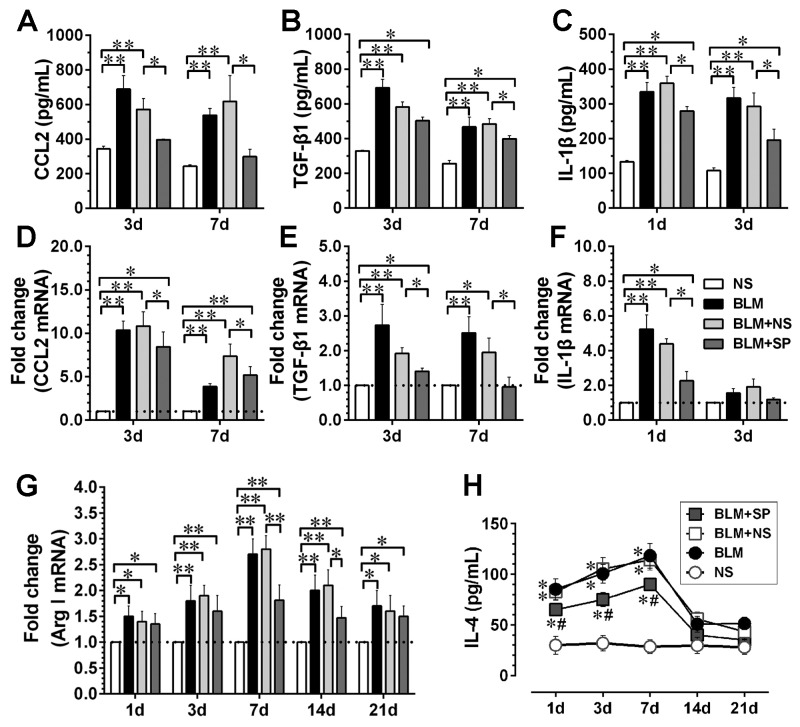
Figure 4. Spironolactone reduces bleomycin-induced inflammatory and profibrotic cytokine expression.
Figures A to C show the protein levels of CCL2, TGF-β1 and IL-1βin the bronchoalveolar lavage fluid (BALF) detected by ELISA at selected time points. Figures D to F represent the mRNA levels of above three cytokines in lung tissue at selected time points. G shows the dynamic profiles of Arg-1 mRNA expression in lung tissue; H shows the IL-4 protein dynamics in BALF. Abbreviations: CCL2, chemokine (C-C motif) ligand 2; TGF-β1, transforming growth factor β1; IL-1β, interleukin-1β; Arg1, arginase-1; IL-4, interleukin-4. For Figures A to G, *P<0.05; **P<0.01 (n = 5 to 7); For Figure H, *P<0.05 vs. NS group. #P<0.05 vs. BLM and BLM + NS groups (n = 5 to 7).

