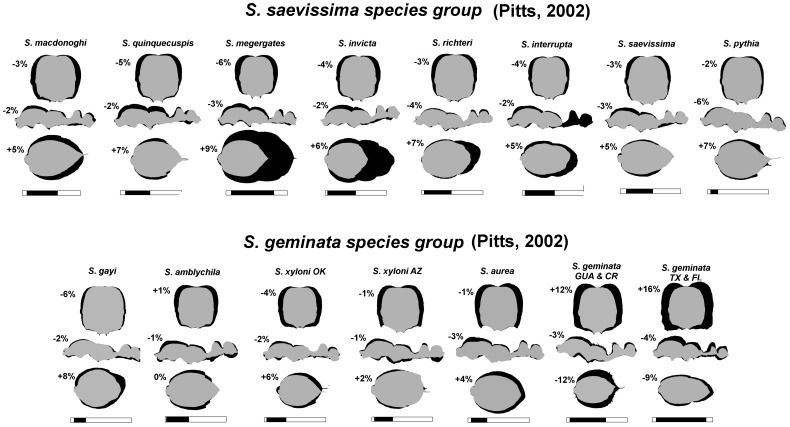
Figure 9. Sillhouettes of the smallest worker body parts (grey) superimposed on those of the largest workers (black) scaled to the same HL, MsL or GL, illuminating the changes of shape occurring during growth.
Images of heads were resized until HL was equal for the smallest and largest worker heads. For images of the mesosoma, MsL was set to be equal (ignoring the petiole), and for images of the gaster, GL was set to be equal. The black zone in the bar under each species shows the size range (BL) of workers on a 5 mm scale. The percent values next to each silhouette are the changes in volume of the body part as a fraction of the whole body (i.e. if the head is 20% of the total body volume in small workers, and 25% in large, the change would be +5%).

