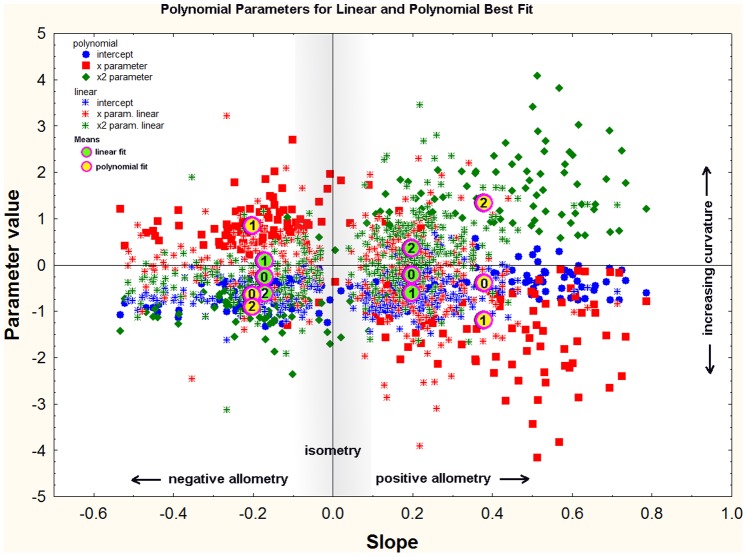
Figure 15. A comparison of the polynomial parameters for regressions best fit by linear or polynomial equations.
The “+” symbols show the relationships with a linear best fit, and the solid symbols those with a polynomial best fit. Red symbols code for the x-parameter and green the x2 parameter. Polynomial best fits are strongly associated with extreme values of the linear slopes, that is, with strong positive or negative allometry, but the effect was stronger for positive allometry. The larger the x2-parameter and the smaller the x-parameter, the more curved was the allometric relationship.

