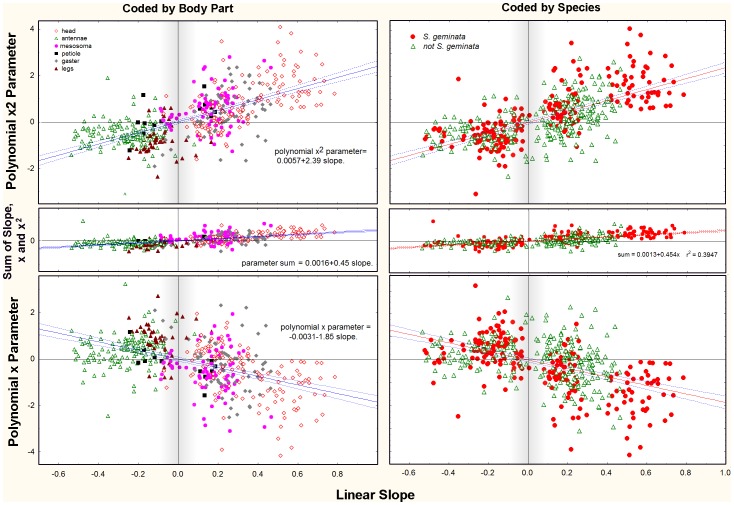
Figure 16. The same data as Fig. 15, but with parameters plotted in separate panels.
The more extreme the linear slope, the more curved the allometric relationship is likely to be, and the more likely that it will be best fit by a polynomial relationship. This can be seen by comparing the top and bottom panels: as linear slope increases, the x2 parameter increases (positive allometry) or decreases (negative allometry) at the expense of the x-parameter. Their opposite trends define the curvature of the allometry. The center panels show the sums of the absolute values of the x2 and x parameters, illustrating that the compensation is not complete. In this figure, the symbols are coded by body part (left panels) or by S. geminata and other species (right panels). Curved, polynomial best fits are more common in S. geminata, and are more likely to affect the head, antennae and gaster.

