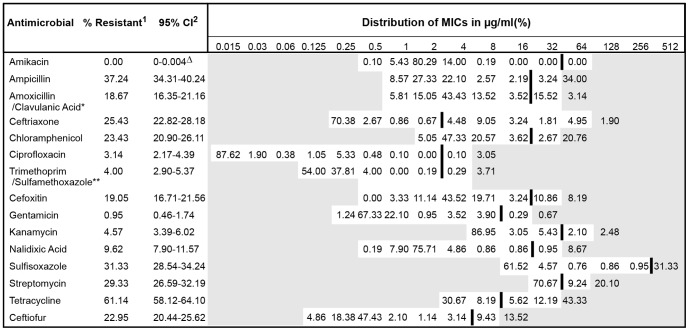
Figure 2. Distributions of minimum inhibitory concentrations of 1,050 non-type-specific E. coli isolates against 15 antibiotics.
Unshaded areas indicate the dilution range of the Sensititre® plate used to test isolates. Vertical bars indicate the CLSI resistance breakpoint when available, or else NARMS consensus breakpoint. Sum of numbers beyond vertical bar represents the percentage of isolates that grew beyond the CLSI breakpoint (or, NARMS consensus breakpoint). These were considered resistant in this study. Numbers in the shaded area indicate the percentage of isolates that had an MIC greater than the highest concentration tested. * Amoxicillin shown, clavulanic acid at 1/2X concentration that of amoxicillin. ** Trimethoprim shown, sulfamethoxazole at 19X concentration that of trimethoprim. 1 Percent of the isolates that were resistant out of the total 1,050 non-type-specific E. coli isolates tested. 2 95% confidence interval was calculated using exact binomial method. ▵ One-sided 97.5% confidence interval; used only when estimate was zero.

