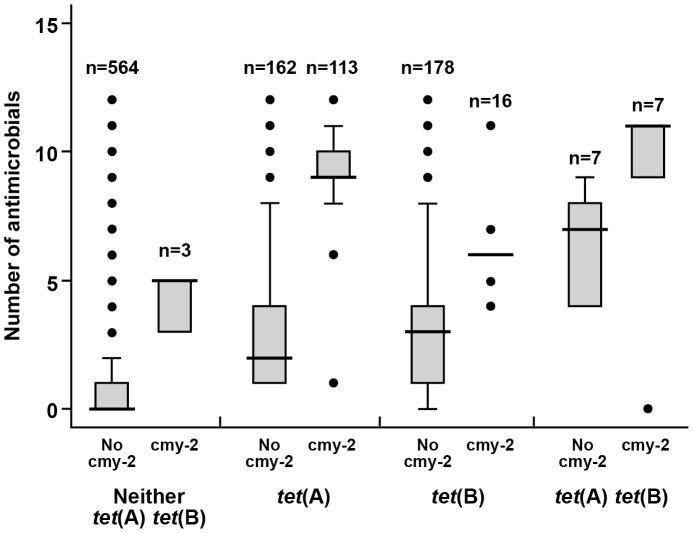
Figure 5. Box plot of the phenotypic multidrug resistance count cross-tabulated by different resistance gene combinations.
Legend terms: cmy-2, no cmy-2, tet(A), tet(B), tet(A)tet(B), neither tet(A) tet(B) in the figure are used for isolates that were found to be positive for bla CMY-2, negative for bla CMY-2, positive for tet(A), positive for tet(B), positive for both tet(A) and tet(B), and negative for tet(A) and tet(B) genes, respectively. Horizontal bars indicate the median number of antimicrobials among each of gene combinations.

