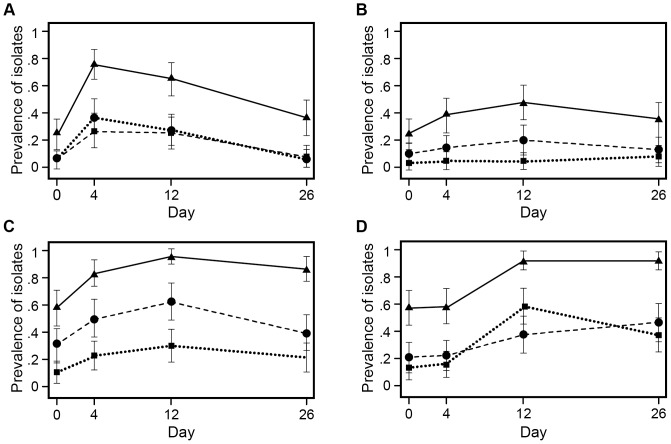
Figure 7. Prevalence of tetracycline-resistant E. coli isolates, modeled as marginal predicted probabilities, over days.
Solid line represents the proportion of NTS E. coli isolates expressing phenotypic tetracycline resistance; dashed line represents the proportion of NTS E. coli isolates harboring the tet(A) gene; dotted line represents the proportion of NTS E. coli isolates harboring the tet(B) gene. The four treatment groups are: (A) CCFA administered to all steers within pens without subsequent CTC administration at pen level; (B) CCFA administered to 1 out of 11 steers within pens without subsequent CTC administration at pen level; (C) CCFA administered to all steers within pens followed by CTC administered at pen level; (D) CCFA administered to 1 out of 11 steers within pens followed by CTC administered at pen level.

