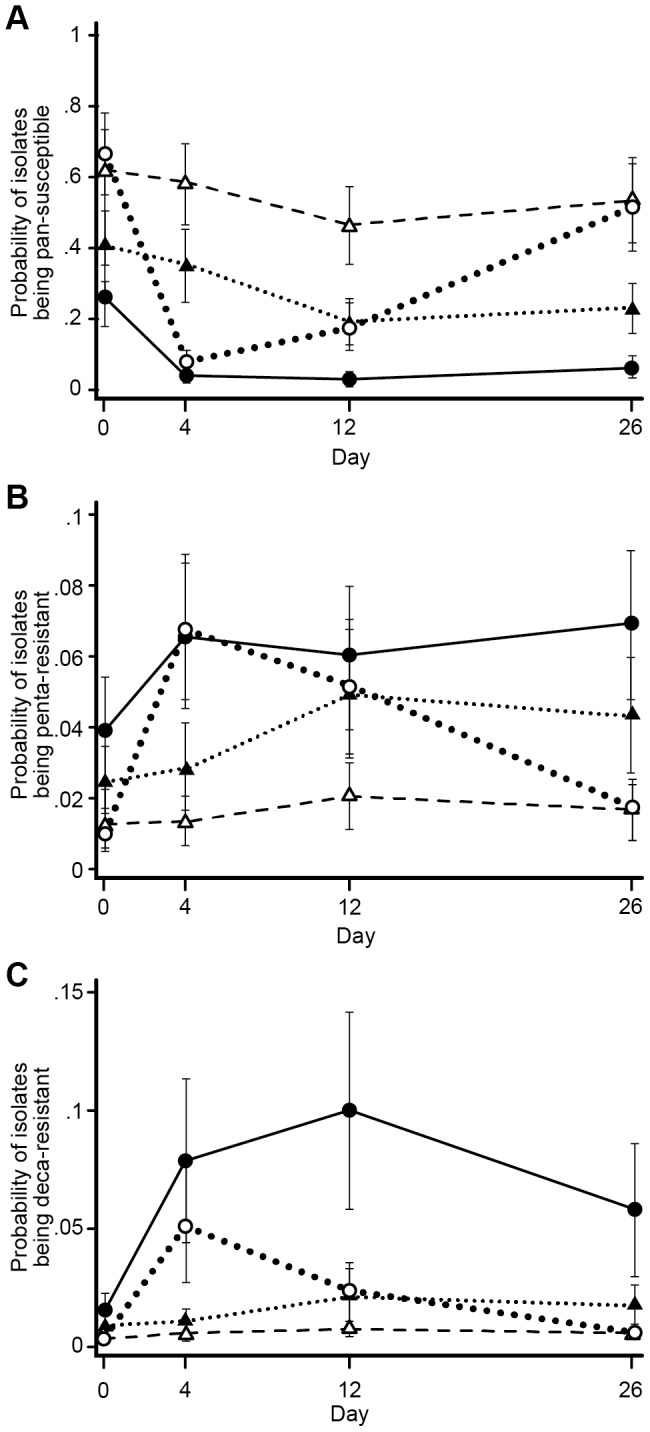
Figure 8. Probabilities of E. coli isolates to be pan-susceptible, penta-resistant, or deca-resistant among treatment groups.

The three sub-graphs represent modeled marginal predicted probabilities for E. coli isolates to be (A) pan-susceptible, (B) penta-resistant, or (C) deca-resistant among the four treatment groups. The four treatment groups are represented by four lines in all three sub graphs. Dotted (large) line represent pens with CCFA administered to all steers within pens without subsequent CTC administration at pen level; Dashed line represents CCFA administered to 1 out of 11 steers within pens without subsequent CTC administration at pen level; solid line represents CCFA administered to all steers within pens followed by CTC administered at pen level; dotted (small) line represents CCFA administered to 1 out of 11 steers within pens followed by CTC administered at pen level.
