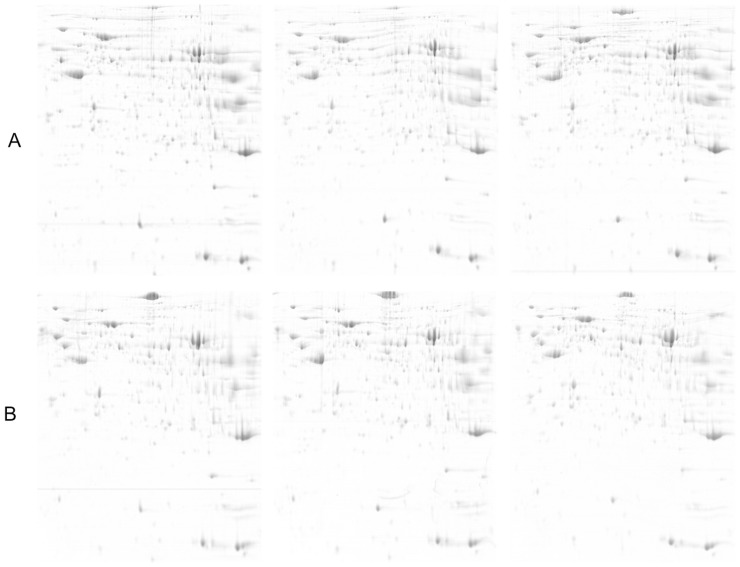
Figure 1. Representative 2-DE images of proteins extracted from dairy goat liver.
A) Control group; B) High-grain diet group. Equal amounts of protein (850 µg) were loaded and separated on 17-cm IPG strips (pH 3–10), followed by electrophoresis on 12.5% SDS-PAGE gels for second dimension electrophoresis. The gels were stained with CCB G250. Experiments were performed in triplicate.

