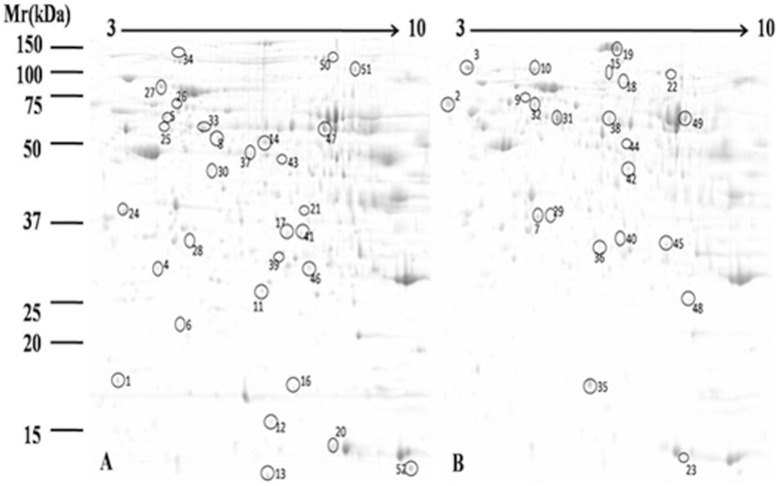
Figure 2. 2-DE patterns of proteins extracted from dairy goat liver.
A. Control group; B. High-grain diet group. Fifty-two differentially expressed proteins showing significant spot intensity changes are marked in A and B. The proteins to which these 52 differentially expressed protein spots correspond are listed in Table 2.

