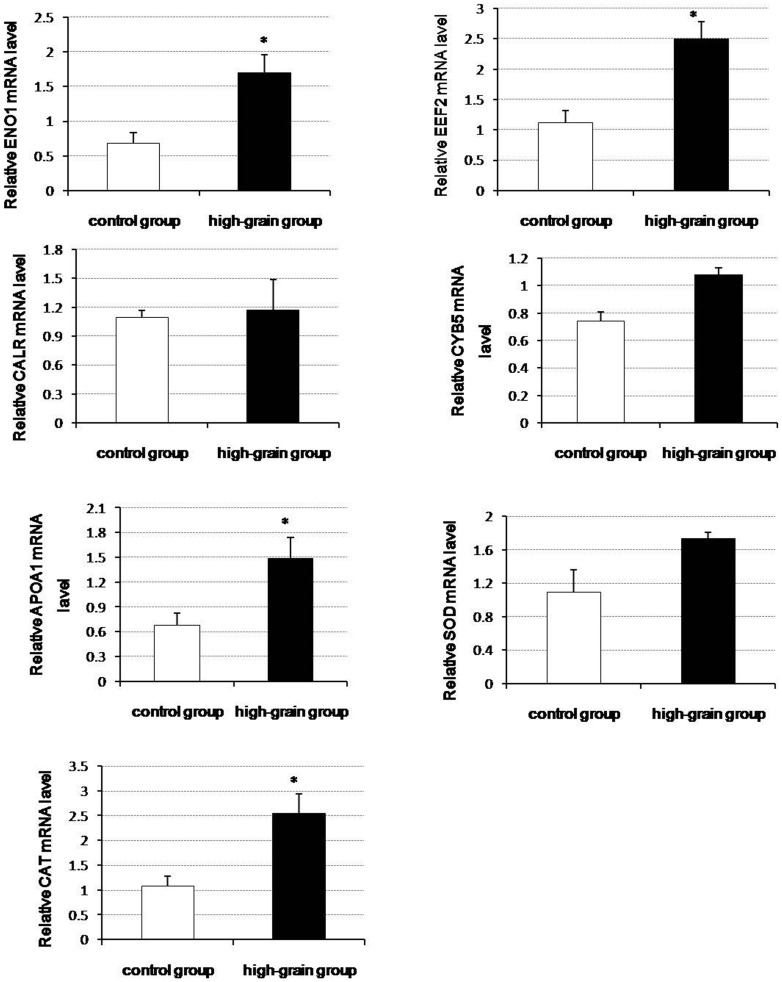
Figure 3. Validation of nine differentially expressed proteins by qRT-PCR analysis.
The experimental procedure and the statistical analyses for the parallel runs are described in “Materials and Methods.” Values are presented as means ± SD; n = 5. * indicates P<0.05. ENO1: alpha-enolase; EEF2: elongation factor 2; CALR: calreticulin; CYB5: cytochrome b5; APOA1: apolipoprotein A-I; SOD: superoxide dismutase (Cu-Zn); CAT: catalase.

