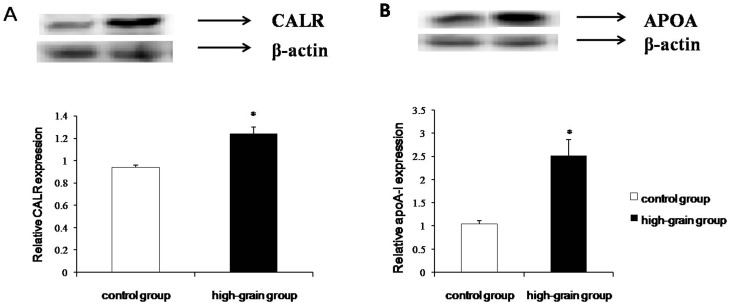
Figure 4. Western blot analysis of calreticulin (CALR; A) and apolipoprotein A-I (ApoA-I; B) in liver tissue samples from high-grain diet and control groups.
Protein extracts of liver tissue samples were prepared and subjected to immunodetection with the indicated antibodies. Intensities of CALR and ApoA-I bands were normalized to the corresponding β-actin control. Values are presented as means ± SD; n = 5. * P<0.05.

