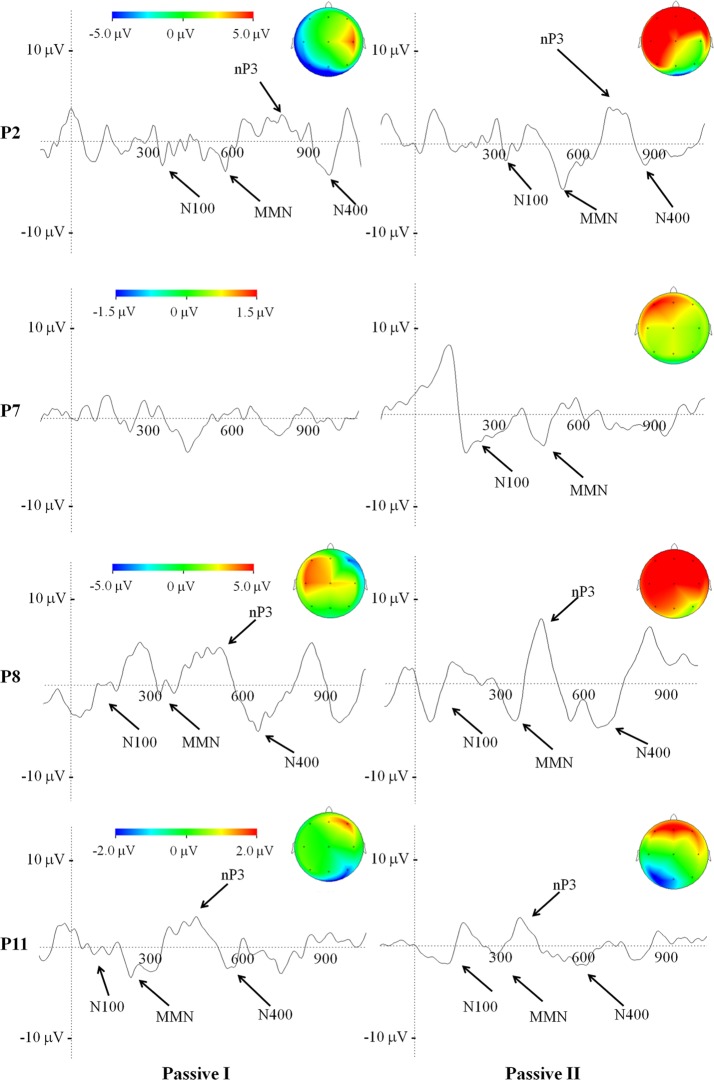
Figure 3.
Average of ERP waveforms and scalp potential topography depicted at Cz of passive condition related to the first and to the second recording session, in patients who underwent a change in their clinical status, according to the CRS-R. Color bar code for the amplitudes of the scalp maps and give the size of the nP3 projections at the time point of the maximum peak.

