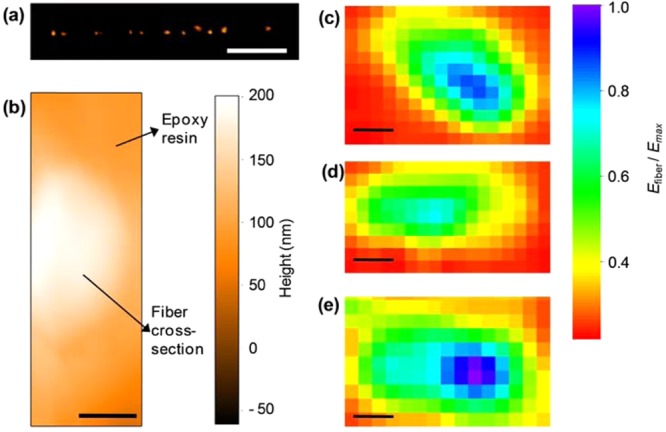
Figure 2.

(a) Confocal emission image of the cross-sectional surface of an array of MEH-PPV fibers. Scale bar: 10 μm. (b) Tapping mode topography micrograph of the cross-sectional surface of an individual MEH-PPV nanofiber (bright region). The fiber is embedded in a UV-cured polymer. Scale bar: 200 nm. (c–e) Examples of cross-sectional Young’s modulus (normalized to the maximum value, Emax) maps measured by AFM indentation measurements (force–distance curves). The orange-red regions correspond to the cured polymer embedding the fibers. Scalebars: (c) 500, (d) 200, and (e) 300 nm, respectively.
