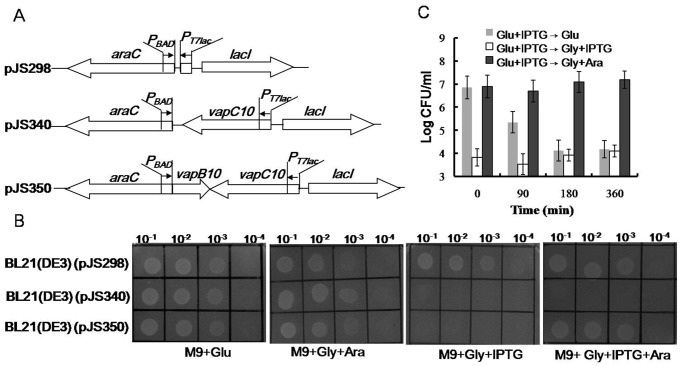
Figure 2. Effects of VapB and/or VapC10 on E. coli growth.
(A) Schematic diagram showing the structures of the selection expression plasmids. (B) Drop growth experiments of the corresponding selection expression strains. The E. coli strain BL21(DE3)(pJS298) was used as the negative control. Diluted samples of each culture were dropped on the indicated M9 plates. (C) CFU counts of the E. coli strain BL21(DE3)(pJS350) after the stop of VapC10 production or the subsequent production of VapB10. The IPTG-induced cells of BL21(DE3)(pJS350) were transferred at the indicated time points to the plates M9+Glu (Glu+IPTG→Glu), M9+Gly+IPTG (Glu+IPTG→Gly+IPTG) and M9+Gly+Ara (Glu+IPTG→Gly+Ara). CFUs were counted after incubation at 37°C for 30 h. Error bars indicate the standard errors of the means from three independent experiments.

