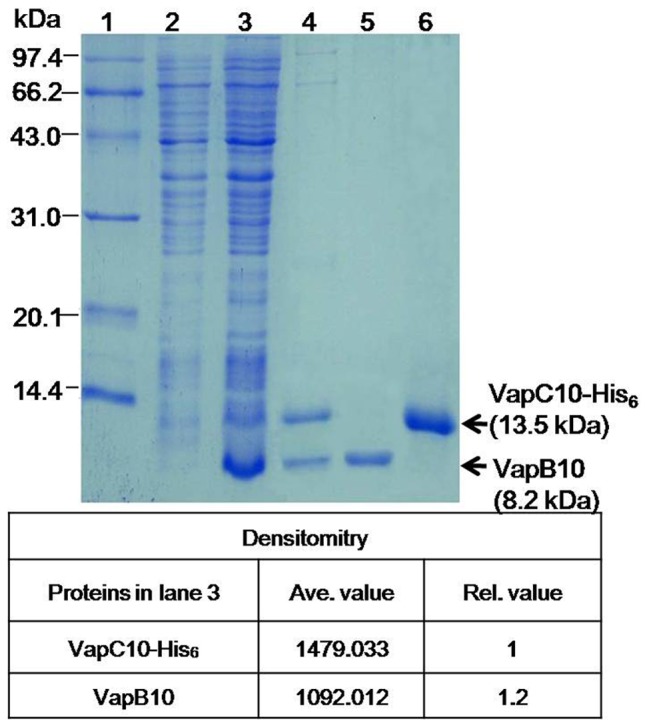
Figure 3. SDS-PAGE analysis of the recombinant proteins from the IPTG-induced cells of E. coli BL21(DE3)(pJS653).

Lanes: 1, protein molecular weight standard; 2, crude extract of un-induced cells; 3, crude extract of IPTG-induced cells; 4, co-purified proteins under native conditions; 5 and 6, purified and refolded proteins VapB10 and VapC10-His6, respectively. The densitometry values and the relative molar ratio of VapB10 to VapC10-His6 are shown at the bottom panel.
