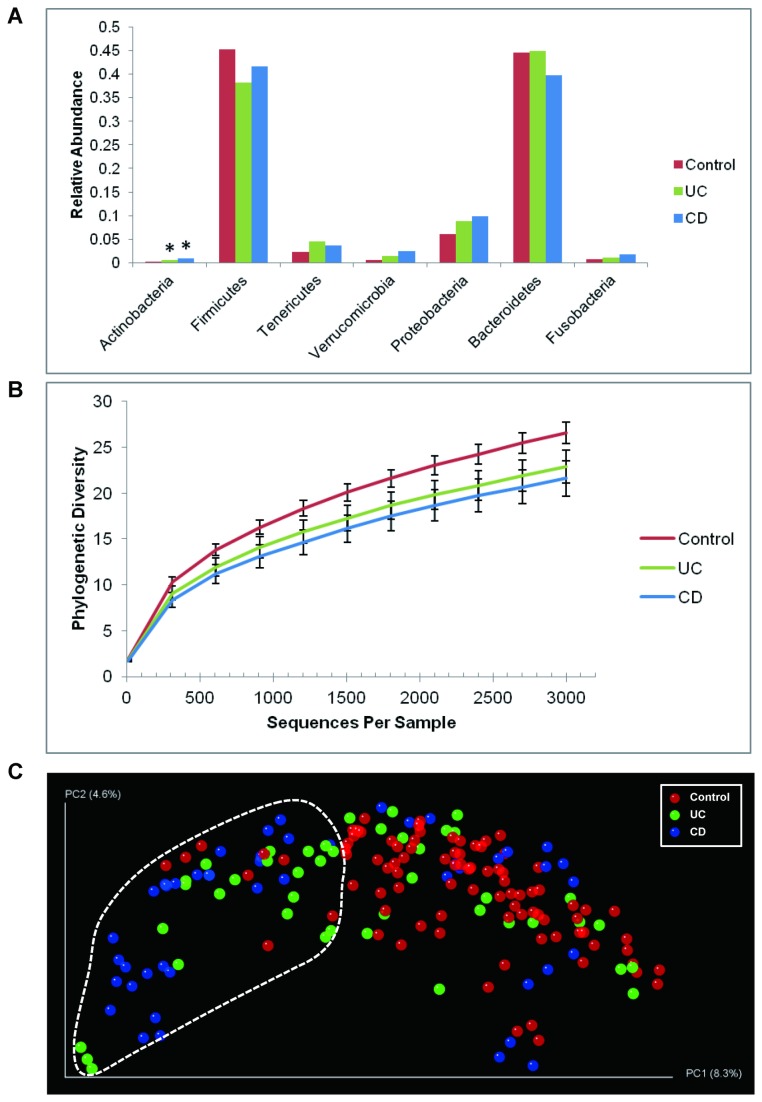
Figure 2. Shifts of mucosal microbial composition in IBD patients in remission.
(A) The change of relative abundance between disease states at phylum level. *: P < 0.05 compared to control, ANOVA. (B) Phylogenetic diversity curves for the microbiota from lavage samples. Mean ± 95% CI was shown. (C) Communities clustered using PCoA of the unweighted UniFrac distance matrix. Each point corresponds to a sample colored by disease phenotype. The dotted line indicated the cluster of samples enriched for IBD subjects.

