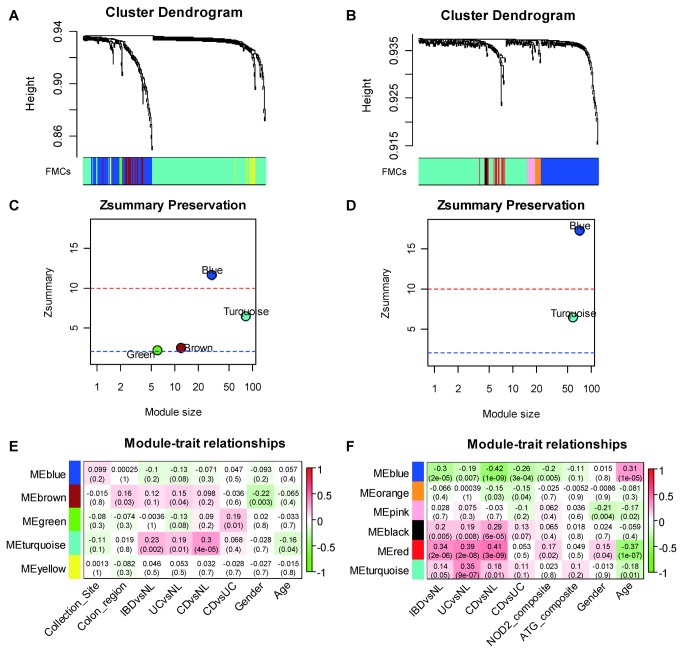
Figure 3. Identification of preserved functional microbial communities (FMCs) associated with disease phenotype across studies.
Hierarchical clustering dendrograms of genera based on microbial co-occurrence network using the Tong dataset (A) and the Frank dataset (B) are shown. In the dendrograms, each color represents one FMC, and each branch represents one genus. The Z-summary statistic plots (y-axis) as a function of the module size are shown for the Tong dataset (C) and the Frank dataset (D). Each point represents a module labeled by color. The dashed blue and red lines indicate the thresholds Z = 2 and Z = 10, respectively. FMC-trait correlations and P values of the Tong dataset (E) and the Frank dataset (F). Each cell reports the correlation coefficient (and P value) derived from correlating FMC eigenvectors (rows) to traits (columns). The table is color-coded by correlation according to the color legend. Collection site: University of California Los Angeles or Cedars Sinai Medical Center; Colon region: 5 anatomical regions coded from 0 to 5, which are cecum, ascending colon, transverse colon, descending colon and rectum.

