
Figure 4. Variations of KEGG metabolic pathways in the functional microbial communities.
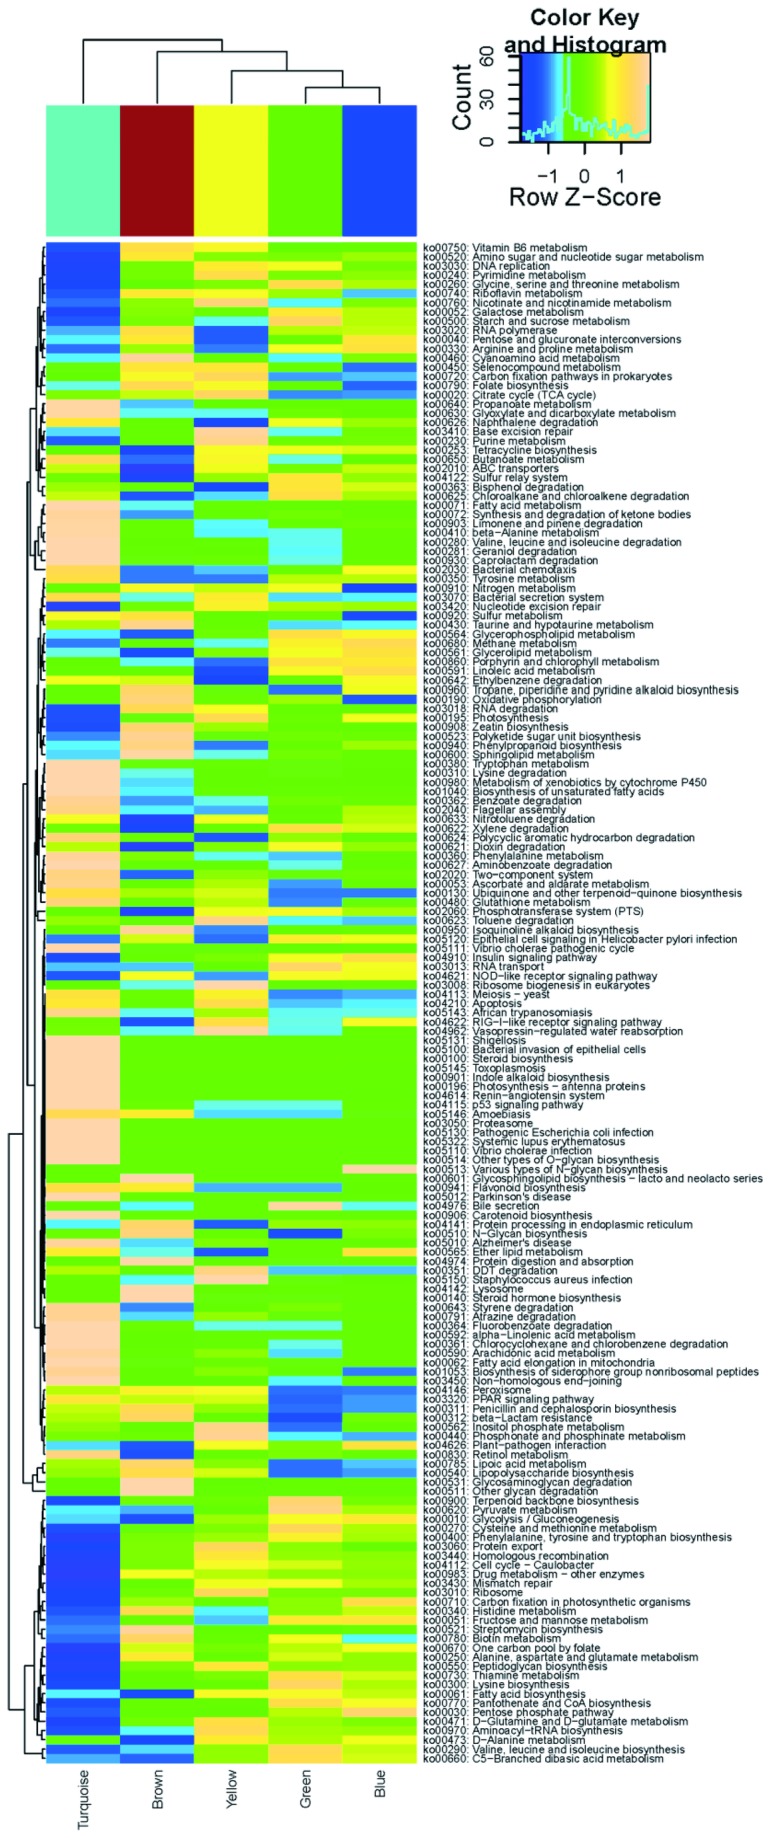
The heatmap shows the functional profiles of FMCs (columns) based on the relative abundance of KEGG metabolic pathways (rows) after z score transformation. The color bar on top shows module membership. The dendrograms show the hierarchical clustering of columns and rows respectively using Euclidean distance.