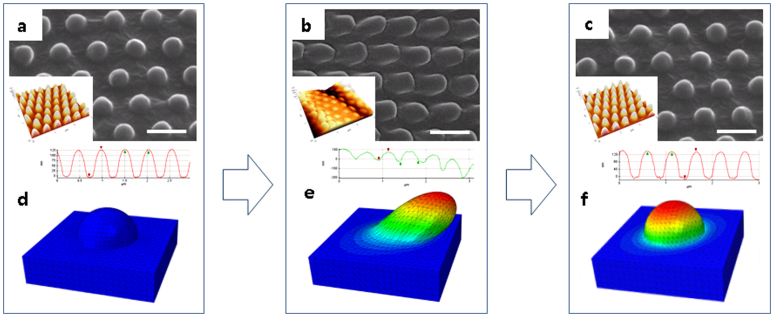
Figure 3. Shape Recovery Characteristics of nanolens array.
(a), (b), (c), SEM images of the nanolens array ((a) initial, (b) deformed, and (c) recovered states). The nanostructure is deformed by an external force. After then, the microwave is irradiated on the nanolens array, thus recovering its original shape. The scale bars indicate 500 nm. AFM analyses for the nanolens array are carried out (the insets). The shape recovery behavior of the nanolens array is identified in a quantitative manner (shape recovery ratio of 97.6%). (d), (e), (f), Finite element analyses for the shape memory nanolens array ((h) initial, (i) deformed, and (k) recovered states). The modeling is performed using the thermomechanical cycle of stress, strain, and temperature.

