. 2011 Jun;27(2):85–93. doi: 10.5487/TR.2011.27.2.085

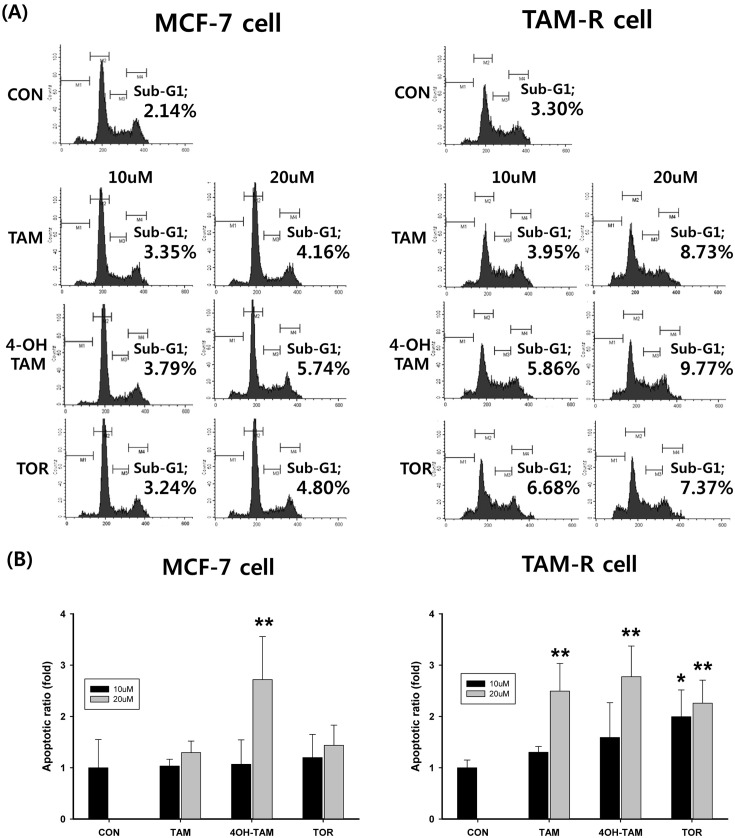
Fig. 2. Effects of SERMs-induced apoptosis in MCF-7 and TAM-R cells. MCF-7 cells and TAM-R cells were treated with SERMs including TAM, 4-OH TAM, and TOR and then incubated in an incubator for 24hr, re-suspended in 75% ethanol, and stained with 50 μg/ml PI containing 0.1% Triton X-100 and 0.02 mg/ml EDTA. The DNA content of cells was measured by flow cytometry and cell cycle profiles were analyzed using CellQuest software. (A) Flow cytometeric histogram of control group, TAM, 4-OH TAM, and TOR treat group. Sub- G1 area presented apoptosis. (B) Apoptotic ratio was calculated with the control group considered to be 1fold. Data are expressed as mean ± S.D. of three independent experiments (*p< 0.05, **p< 0.01, in comparison with control).

Fig. 2.