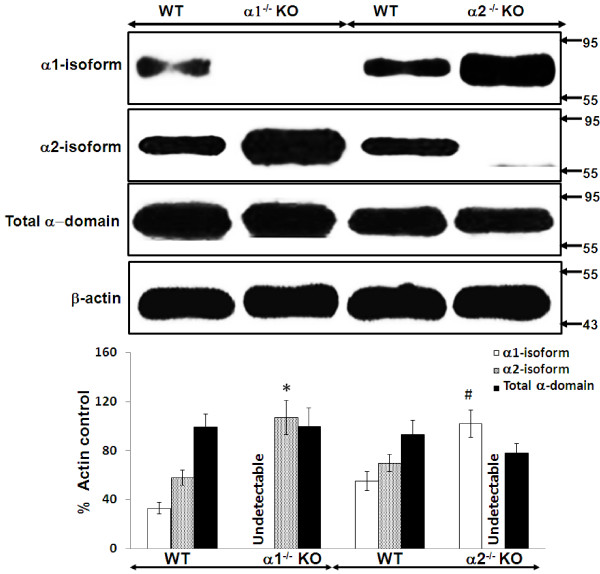
Figure 3.
Relative expression of the catalytic alpha (α) domain of AMPK in whole kidney cortex obtained from α1-/- and α-/- knockout (KO). The relative expression of the α1 and α2 isoforms of AMPK, and of the total α(α1 + α2) domain, was evaluated in immunoblots of lysates of “snap frozen” samples of kidney cortex, obtained from α1-/- or α2-/- KO mice and their WT controls. Upper panel: Representative immunoblot. Molecular weight markers (in kDa) are shown on the right of each immunoblot. Lower panel: Densitometric quantitation of three immunoblots using β-actin as a loading control. * p < 0.01, α1-/- vs. WT mice, for α2 isoform expression; # p < 0.02, α2-/- vs. WT mice, for α1 isoform expression.

