Figure 7.

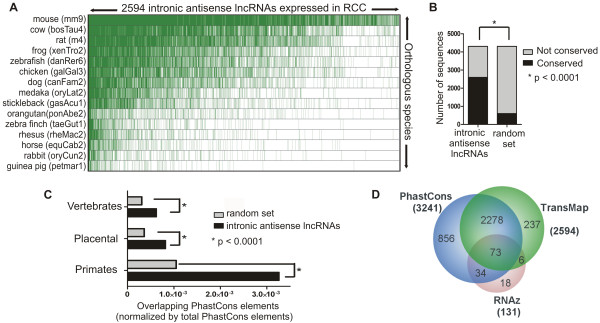
Conservation analysis of intronic antisense lncRNAs expressed in RCC. (A) TransMap cross-species cDNA alignments in 15 vertebrate species (rows; species common name and library version in brackets) of 2594 intronic antisense lncRNAs expressed in renal tissue and with conserved expression in at least one species (green dashes show expression conservation). (B) Bar graph of the TransMap analysis showing a higher proportion of expression conservation of the lncRNA dataset compared with a random sequence dataset (Fisher test p <0.0001). (C) DNA sequence conservation of antisense lncRNAs within vertebrates, placental and primates groups. Black bars show the number of lncRNAs, and gray bars the number of random genomic regions, overlapping PhastCons elements (see Material and methods for details). Asterisks show statistically significant differences in the number of overlapping elements (Fisher test p <0.0001). (D) Venn Diagram of three different conservation analyses of the intronic lncRNAs expressed in RCC: RNAz predicted secondary structure conservation for 131 lncRNAs, PhastCons DNA sequence conservation for 3241 lncRNAs and TransMap expression conservation for 2594 lncRNAs.
