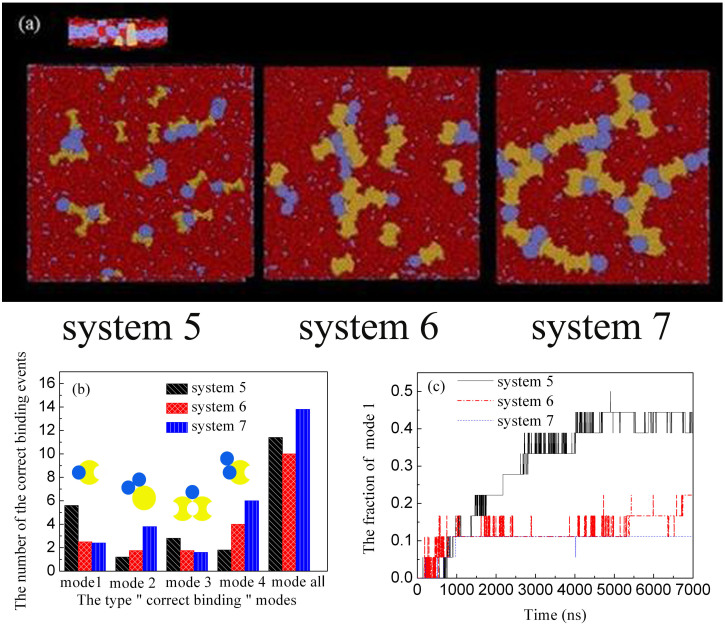
Figure 4. Protein aggregate with different sizes after 3840 ns.
System 5: protein Aeq (D = 4.5 nm) and protein B (D = 3.23 nm), System 6: protein Aeq (D = 5.8 nm) and protein B (D = 3.23 nm), System 7: protein Aeq (D = 7. 1 nm) and protein B (D = 4.5 nm). (a) Typical top view snapshots of protein aggregation, where protein Aeq is shown in yellow, protein B in blue, lipid membrane in red. (b) The number of different “correct binding” modes in the three systems. (c) The fraction of mode 1 in different systems as a function of time.

