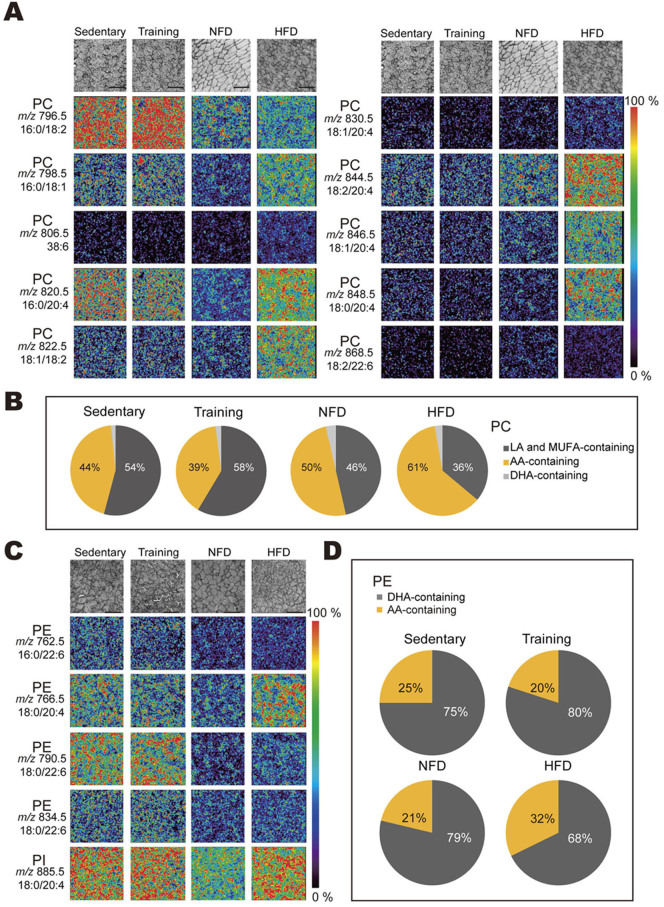
Figure 3. Imaging mass spectrometric analysis results.
(A) Positive-ion mode analyses reveal PC molecular species distribution. (B) Graph of IMS analyses of PC composition. (C) Negative-ion mode analyses reveal PE and PI molecular species distribution. (D) Graph of IMS analyses of PE composition. Scale bar is 200 μm. Color bars represent relative intensity values. These data were normalized with total ion current.

