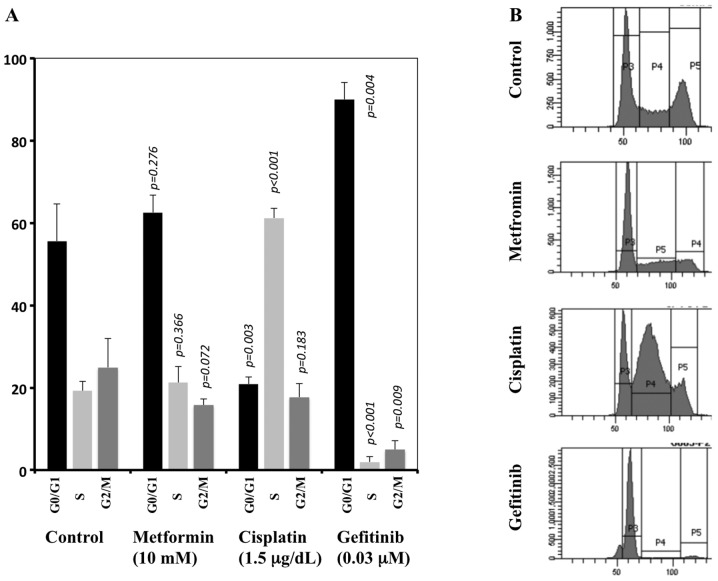
Figure 6.
Altered cell cycle distributions 24 h after exposure to the agents, assessed by FACS. The cell cycle distribution was not significantly altered with metformin, in contrast with cisplatin and gefitinib. The columns and bars represent the mean and SE [n=3, (A)], respectively. The p-value for difference between each column and the corresponding column in the control is given. A representative FACS analysis with each agent is shown (B).

