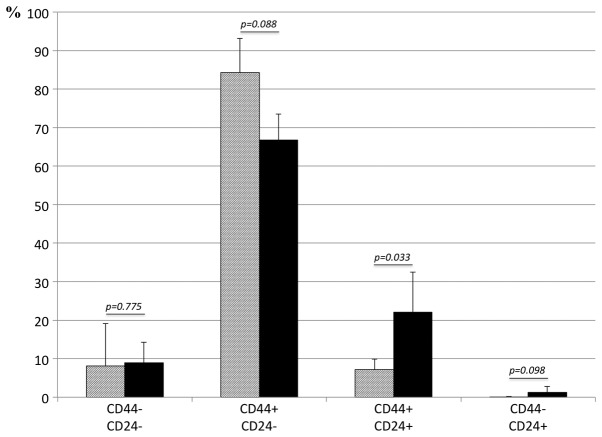
Figure 8.
FACS analysis for altered expression of CD24 and CD44 after gefitinib treatment. The shaded and closed columns represent the mean percentages of the untreated and treated cells, respectively. The bars represent the SE (n=3). CD24 expressing cells significantly increased during gefitinib treatment, from ∼8–23%, with CD44 expressing cells unaltered.

