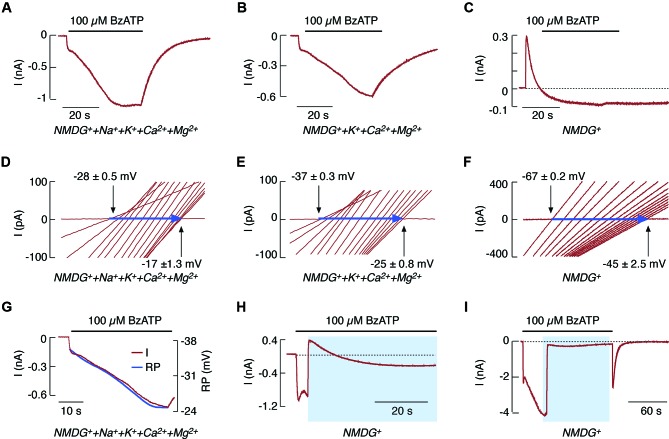
Figure 1.
NMDG+ permeability of rP2X7R expressed in HEK293 cells. (A–F) Patterns of BzATP-induced currents (A–C) and reversal potentials (D–F) in cells continuously bathed in media containing NMDG+, Na+, K+, and divalent cations (A and D); NMDG+, K+, and divalent cations (B and E); and NMDG+ only (C and F). This figure (as well as the one following) shows that whole-cell current recordings were performed at a holding potential of −60 mV, and agonist was applied for 40 s. Voltage ramps were delivered twice per second during the 40 s agonist application to record positive shifts in reversal potential (horizontal blue arrows); only 15 traces (out of a total of 100) for the current-voltage relationship with equal time intervals are shown. (G) Comparison of the kinetics of secondary current growth (red trace) and of changes in reversal potential (RP; blue trace) in cells bathed in media containing NMDG+ and divalent cations during the 40 s application of BzATP. (H and I) 100 μM BzATP-induced current profiles in cells bathed in a normal physiological solution for 4 s (H) and 40 s (I), and in NMDG+-containing media for the rest of the agonist application time. Horizontal black lines above the traces indicate the duration of BzATP application, and blue areas indicate the duration of NMDG+ application. Derived from Yan et al. (2008, 2010).

