Figure 2.
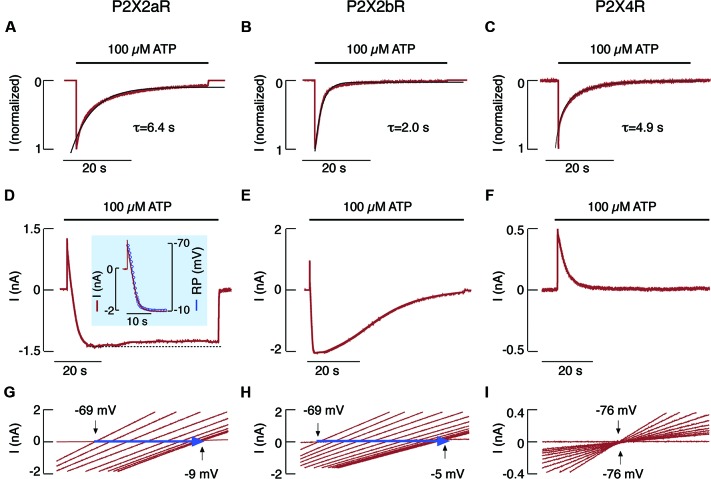
NMDG+ permeability of rP2X2aR, rP2X2bR and rP2X4R expressed in HEK293 cells. (A–C) Patterns of ATP-induced currents in cells bathed in a normal physiological medium. Traces shown were obtained during the first (P2X4R) and third (P2X2aR and P2X2bR) ATP application. Black lines indicate exponential fittings, with τdes shown below the traces. (D–I). Patterns of ATP-induced current (D–F) and reversal potential (G–I) in cells that have been continuously bathed in a medium containing only NMDG+. (D, inset) Temporal correlation between P2X2aR current (red trace) and reversal potential (blue circles). Note the lack of inward current (F) and the positive shift in reversal potential (I) in cells expressing P2X4R. Derived from Khadra et al. (2012).

