
Figure 2.
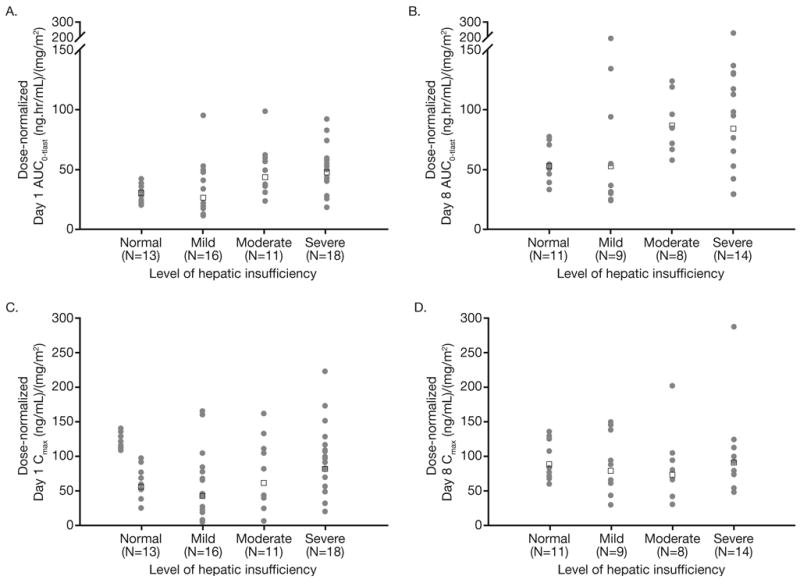
Individual (filled circles) and geometric mean (open squares) values of dose-normalized AUC0-tlast on day 1 (A) and day 8 (B), and dose-normalized Cmax on day 1 (C) and day 8 (D), by hepatic function group.
Official websites use .gov
A
.gov website belongs to an official
government organization in the United States.
Secure .gov websites use HTTPS
A lock (
) or https:// means you've safely
connected to the .gov website. Share sensitive
information only on official, secure websites.
Individual (filled circles) and geometric mean (open squares) values of dose-normalized AUC0-tlast on day 1 (A) and day 8 (B), and dose-normalized Cmax on day 1 (C) and day 8 (D), by hepatic function group.