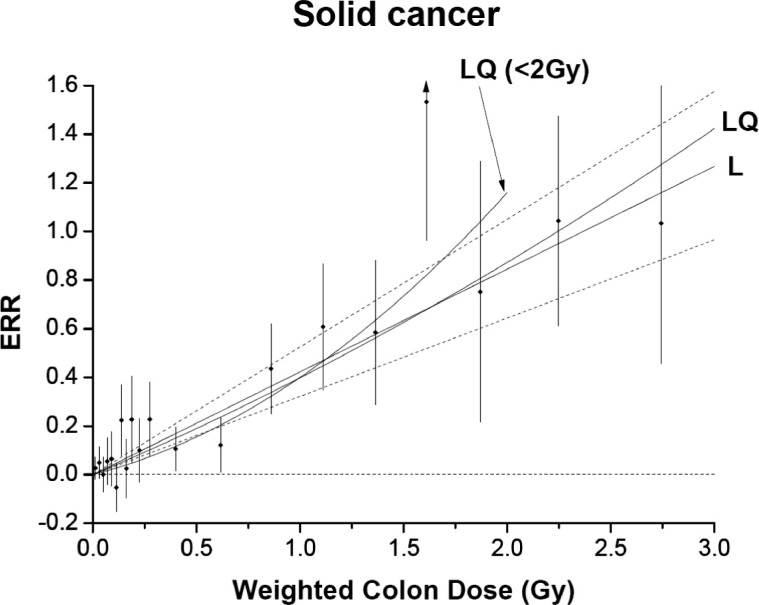
FIGURE 1.
From Ozasa et al. (Ozasa et al., 2013). Excess relative risk (ERR) for all solid cancer mortality in atomic bomb survivors in relation to radiation exposure. The black circles represent ERR and 95% CI for the dose categories, together with trend estimates based on linear (L) with 95% CI (dotted lines) and linear-quadratic (LQ) models using the full dose range, and LQ model for the data restricted to dose < 2 Gy. Figure reproduced with permission from the Radiation Research Society.

