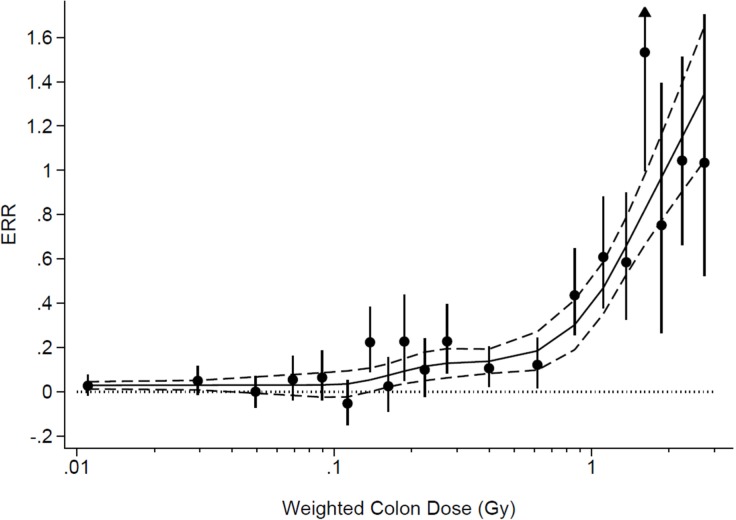
FIGURE 2.
Excess relative risk (ERR) for all solid cancer in atomic bomb survivors in relation to radiation exposure. The black circles and error bars represent ERR and 95% CIs for the dose categories. Data from (Ozasa et al., 2013). Solid Line - fit to the ERR data using a multiple linear regression in which weighted log colon dose was entered into the model using a restricted cubic spline transformation with five knots. Regression weights were equal to the inverse of the variance of the point estimates. Dashed lines are 95% CI of the fit. Figure from performing analysis equivalent to (Doss et al., 2012) with the corrected data in (Ozasa et al., 2013). Figure provided by Brian L. Egleston.

