Figure 6.

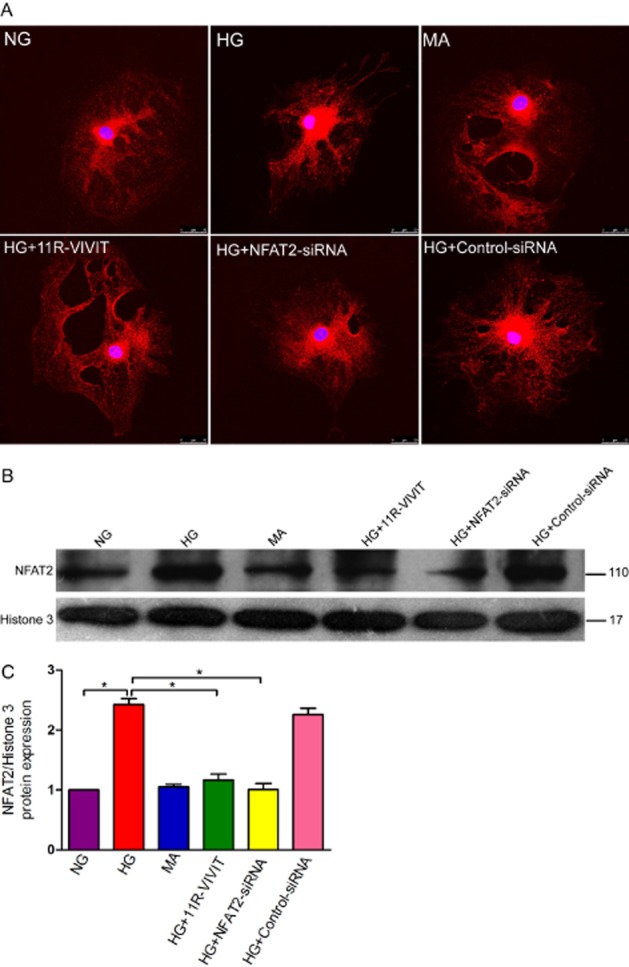
Effects of 11R-VIVIT and NFAT2 gene knockdown on the expression of NFAT2 in podocytes treated with high glucose. (A) Confocal images of podocytes showing the expression of NFAT2 (red) and DAPI-stained nuclei (blue). (B) High glucose treatment increases the expression of NFAT2 detected by immunoblot in a nuclear extract of podocytes. Histone 3 was used as a nuclear protein control. (C) Densitometric analysis of three repetitions of the experiment shown in (C). Values are expressed as the mean ± SEM. *P < 0.01 versus HG. Note NG, normal glucose (5.3 mM) group; HG, high glucose group (30 mM); MA, normal glucose (5.3 mM) + mannitol (24.7 mM) group, as an osmolality control; HG+11R-VIVIT, high glucose (30 mM) + 11R-VIVIT(100 nM, a cell permeable NFAT inhibitor) group; HG + NFAT2-siRNA, high glucose (30 mM) + NFAT2-siRNA (50 nM) group; HG + control-siRNA, high glucose (30 mM) + control- siRNA (50 nM), as a negative control group. High glucose increased the nuclear localization of NFAT2 in podocytes, and this effect was blocked by either 11R-VIVIT, a cell permeable inhibitor of NFAT, or NFAT2-siRNA.
